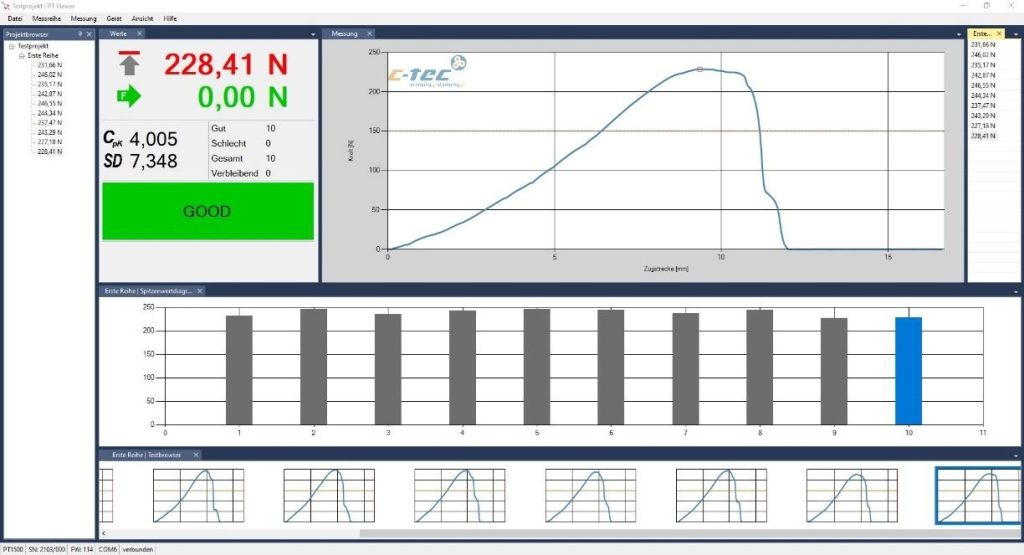
The Pulltest Viewer PTV 3 is Windows software developed for the visualisation, storage and statistical evaluation of pull-out force tests. It allows force curves to be displayed, measurement values to be stored and the results obtained to be statistically evaluated.
The software records test data in real time, evaluates the measured pull-out forces and organises the results into measurement series and projects, facilitating test documentation and archiving.
The Pulltest Viewer PTV 3 graphically displays the pull-out force curve, including the peak value and the defined limit values. Measurement results are automatically evaluated, allowing tests to be identified as pass or fail.
The software allows the results of each test to be monitored through the visualisation of the force curve and the corresponding measurement values.
The Pulltest Viewer PTV 3 continuously calculates the process capability index Cpk, allowing the statistical consistency of pull-out force test results to be evaluated.
The Cpk analysis allows the process capability to be monitored in relation to the defined specification limits, helping to identify deviations and assess process stability and capability.
Results can be monitored through measurement series and graphical representation of peak values, providing a clear overview of process development throughout the measurements.
The PTV 3 allows measurement series to be recorded and the development of peak values to be displayed graphically. Each series can include up to 1,000 individual measurements, allowing detailed analysis of the results.
Up to 25 measurement series can be performed within each project, allowing different sets of tests to be organised in a structured manner.
Test series can be grouped into project files, making it easier to archive and retrieve results. Multiple projects can be opened simultaneously, and measurement values previously stored on pull-out force measuring devices can be imported via .csv files.
The software also allows information relating to the customer and material associated with the tests to be recorded.
Test results can be presented in report or table format, allowing measurement values and their corresponding force curves to be viewed.
Maximum measurement values can be stored and subsequently exported to Excel or printed in PDF format.
✔ Real-time data recording from compatible pull-out force testing equipment
✔ Graphical representation of the pull-out force curve
✔ Display of peak values and limit values
✔ Continuous calculation of the process capability index Cpk
✔ Evaluation of measured pull-out forces
✔ Classification of results as pass or fail
✔ Recording of measurement series with graphical representation of peak values
✔ Up to 1,000 individual measurements per series
✔ Up to 25 measurement series per project
✔ Organisation of test series in project files
✔ Simultaneous opening of multiple projects
✔ Recording of customer and material data
✔ Import of measurement values via .csv files
✔ Presentation of results in report and table format
✔ Export of results to Excel
✔ Printing of results in PDF format
✔ Multilingual software
The Pulltest Viewer PTV 3 is compatible with the following pull-out force measuring devices:
✔ PT-X 250 / 500 / 1000
✔ APT 250 / 500 / 1000
✔ PT 750 / 1500
✔ PT 2500 / 5000
✔ PT 10k Gen2 and HG-i
✔ PT-Clip 3.0
Operating system: Windows 7 or higher
Processor: Intel Core i3 / AMD Athlon 3000 or higher
RAM: 4 GB or higher
Port: USB 2.0
Single-user licence, linked to the computer's hardware ID and activated using a software key.